Working with small teams is a lot of fun and I find it fairly easy to keep track of what is happening with version control and build systems. Errors and failures don’t come up that often and when they do they can quite often get solved there and then. On larger projects or working in a large organisation it’s impossible to keep track of everything. There are too many moving parts and changes. Incidents are more frequent and their impact much larger. A broken build or build system can affect 10s or 100s of people. For these larger development projects I find I have to collect and chart data, looking for tends and anomalies and then delve deeper into the data if and systems if there are problems.
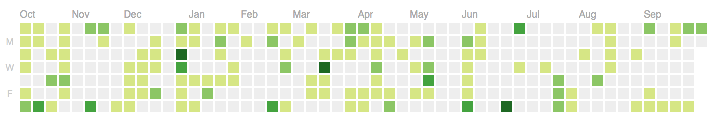
I am facinated with how looking at data in a particular way can provide a better understanding of how things are working and what is bing done by developers and teams. GitHub’s activity heat map is a great example of how a simple visual can help find patterns really quickly. Or in this case how random my code submission have been.
When I first started building web sites it was quite difficult to know if and how the site was being used. Analytics programs that collect, analyse and chart data have become an essential part of of web development. Big data, despite the hype is spawning new toolchains and capabilities that were just unavailable to many teams.
Working with larger organizations on larger programs of work provides additional challenges. It may seem obvious but the shear volume of information generated by the systems that support teams in large organizations is daunting. It has taken a while but version control is pretty much universally part of every developers daily life. I am a firm believer in keeping everything in version control. For a small team working on a single piece of software keeping an eye on what is happening to the source is pretty simple - daily or weekly review and conversations. As things scale up though reviewing 100s of commits would become a full time job or part time for a larger group that then needs to be aligned.
Version control is just one source of data. We have ticketing systems for bugs, requirements management systems, build systems, release systems and a plethora of other data sources. Tracing changes though these disparate systems is hard. Spotting problems is even harder.
We need a way to make this data manageable
Applying big data techniques to development
“The greatest value of a picture is when it forces us to notice what we never expected to see.”
- John Tukey, 1977
Big data systems and the analysis systems that they support have proven very effective in understanding product effectiveness. It is perhaps time to use these tools and techniques to understand the factors that improve software delivery in a quantifiable way.
There has already been some groundbreaking work in this area. The article ‘ Jonathan Andrew Wolter interpreting commit log visualisations’ talks about his work with Miško Hevery showing how analyzing commit logs that are generated as part of development can be used to indicate how a team is adopting new practices.
Products like sonarqube focus on analyzing source code and provide valuable insight into the current health of a code-base. Taking this further by combining this work with other analysis should provide a more complete picture of the development organization and where things can be improved.
Effectiveness
How good is your build system. Is something like this profile of build times good or bad?
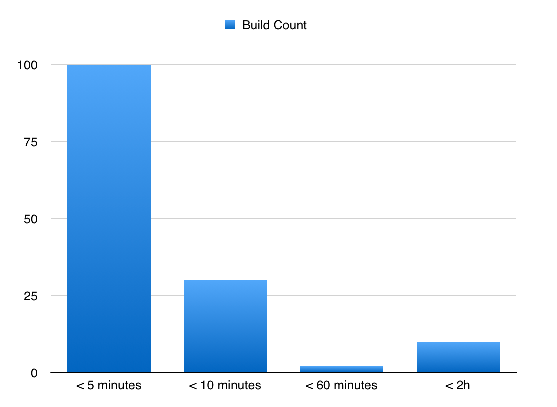
Out of context I have no idea if these numbers are good or bad. But over time and combined with other data we could discern trends and compare different points in time.
Other things that might provide more context for the project
- Build time counts -
- Average mean min/max feedback clycle time per commit
- Commit heat map - when are commits made
- Commit frequency on active projects
- Test to Production commit ratios and trends
- Build times and trends
Hidden commits
Combining commit information from source control and build information from CI systems means that we can measure the latency or cycle time between a commit and the build that used that commit. We can also see how build times might be masking commits that happen during the build:
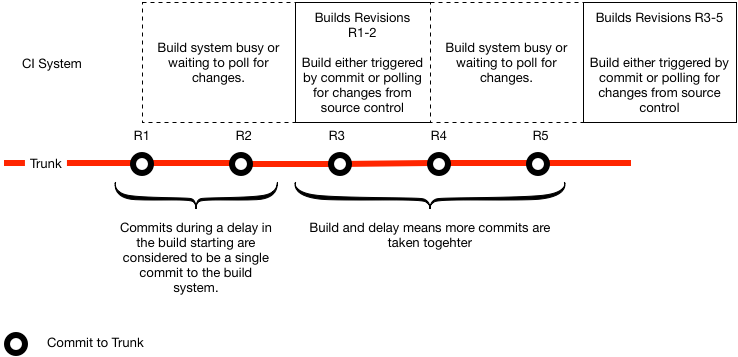
Long delays between builds caused by too much demand or build scheduling means that it is more likely the build will contain multiple commits. Perhaps not a huge problem when everything stays green but if a build fails it is more difficult to find the commit that caused the failure.
The same is true if build times are longer than your regular team commit cycle (time between commits). The first CI stage should be fast to avoid this situation but with many builds it is too expensive to track build times manually. Processing the logs to gather this data regularly and track trends is relatively straight forward and more cost effective.
Another visualisation example is Mark Crossfield’s visualisation of a GO configuration file as a graph realized in D3 GO Delivery Pipeline Visualisation. Again something that would be difficult to do by hand but the patterns presented might reflect improvements over time that lead to a way of spotting problems earlier.
These examples are fairly straightforward but also of limited value. Focusing in on one or two metrics can be dangerous and create anti behavior patterns. By combining measurements from a number of dimensions the expectation is that we can see more macro trends within an organization. For changes we can pose hypotheses about what we expect to happen and then monitor or look for the effects that we expect as well as things that we did not expect.
With so many tools and analyses that have been built to understand how complex systems behave in production maybe we can apply the same tools or techniques to the inner workings of the development organization’s systems.
Summary
The examples above are relatively simple but every journey needs to start with a first step. The code ratios can be generated by parsing data from a single source - version control. Hidden commits are likely to involve two systems - CI and version control.
Collecting, analyzing and visualizing development organization data is still in its infantcy but changing quickly. Having the collection ability means that we can pose hypothoses about the effect of changes on the development eco-system and then monitor indicators to see if the changes are having the expected results. To date this has meant tracking single metrics, probably manually and just tracking the data that caused unexpected side effects.
By tracking many data points we should be able to evolve better models and maybe detect trends and predict future events.
I started the Kuona project to test the viability of these approaches. If you are interested in trying things out for yourself and perhaps getting involved in the project check out the GitHub projects.