During a recent discussion about open source development we wondered how long these projects lasted. In particular if there was a rapid drop off in activity.
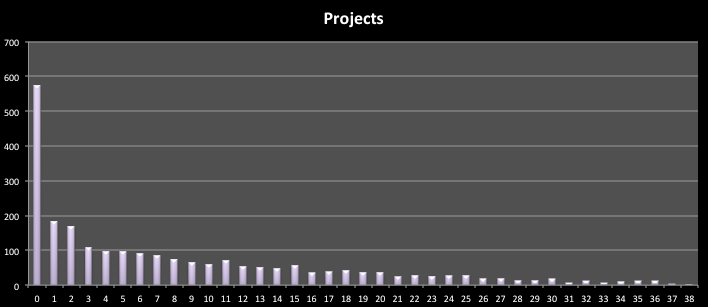
One of the great things about recent open source code repositories is that they often provide APIs allowing this sort of analysis. The chart below was generated from a sample of 2360 public GitHub repositories. I took the started pushed-at and created-at dates to calculate how many days a repository had been worked on. I then grouped them together into 30 day increments and charted the count in each 30 day period.
This has probably been done before but I find the results interesting.