These ideas were presented as at ThoughtWorks Agile Southeast conference in Atlanta. The idea for these diagrams came about after the first time I spoke about web test driven development at Agile East in Philadelphia and New York. I am striving to show how introducing a level of abstraction affects development costs.
Web applications should testing at various levels, from unit tests through acceptance, workflow and performance (to name just a few categories). For the purposes of this article Acceptance and Workflow tests are defined as follows:</p>
Acceptance Tests - validate the content of the returned document from the application (typically) HTML. Using the test form:</p>
Given system in a particular state
When a request for a particular resource is made
Then the returned document contains these
Workflow Tests simulate how a user is expected to interact with the system to perform the anticipated browser actions.</p>
Both Acceptance and Workflow tests could be executed through the browser but the Acceptance tests could be run against the application directly saving the expense of passing data through the browser. Having the Acceptance tests make direct calls to the application being significantly faster means that the feedback cycle is much shorter. Typically there are many more Acceptance style tests than Workflow tests so keeping the Acceptance tests fast is a significant benefit.
Having chosen to take advantage of this performance increase it is likely that the code to exercise the application will be different and use different technologies.
However, there are significant advantages in maintaining a common abstraction layer available to both test types.
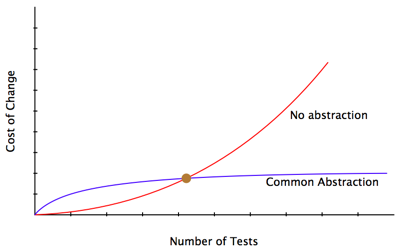
The chart below expresses the cost of changing an application correlated against the number of tests supporting development. The red line represents the cost of change with a minimal or no abstraction. The blue shows change costs if an abstraction layer is introduced early in the project.
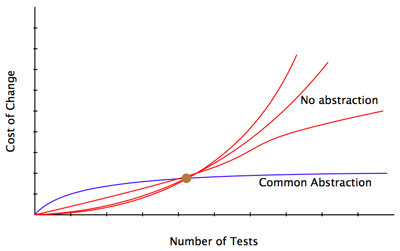
These charts are not supported by project data but illustrate experiences on projects. The next chart illustrates that the red (no abstraction) curve could present a different profile.
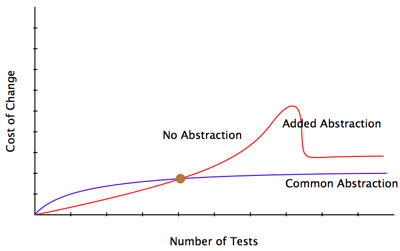
What I am pretty sure I have seen on a project is a team stall unable to proceed because the developing new tests to support new functionality has hit the exponential part of the curve. Having hit this wall there are several options but adding a common abstraction layer to support both Acceptance and Workflow style tests is effective at unblocking the team. This is illustrated by the chart below.
You might have noticed the small brown dot over the intersections of the two lines. If it were possible to identify this point either based on the axes on these charts or some other dimensions then a team could start with a simple ad-hoc approach and then adopt the time saving abstractions as they approach the point where the curves intersect. At the moment not knowing how soon a team would hit this point it would seem prudent to take the cost earlier than later when the cost of changing all the tests is significant.