21. February 2026
Visualizing Project Structure with rv
Visualizing Project Structure with rv
A fast, interactive way to see what’s actually in your project
Every developer has had the experience of opening an unfamiliar codebase and trying to figure out what’s where. You run tree, get a wall of text, and scroll past hundreds of lines of filenames that all blur together. Or you click through directories in your editor, building a mental model one folder at a time. Neither approach gives you the kind of immediate, intuitive sense of a project’s shape that you get from actually working in it for weeks.
rv takes a different approach. Instead of listing files, it draws them – generating a force-directed graph visualization of your directory structure that you can pan, zoom, search, and explore interactively.
What You See
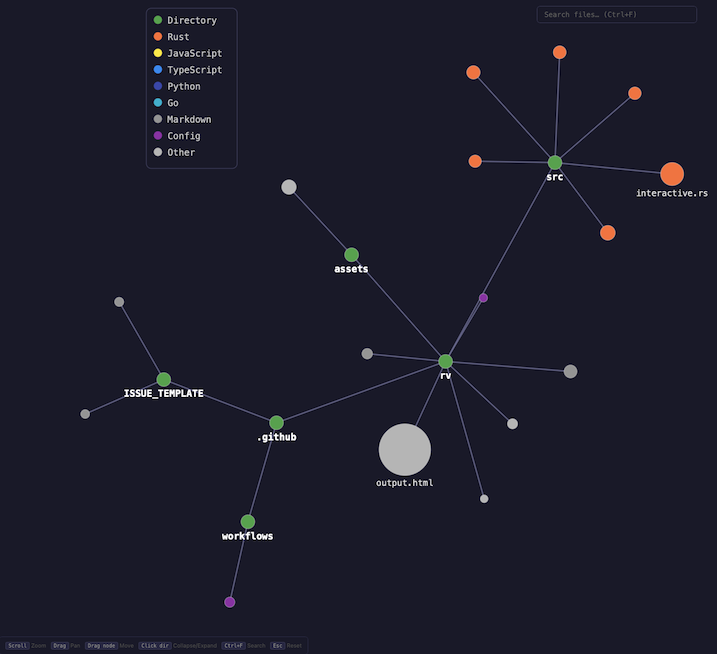
rv scans a directory tree and renders it as an interactive graph where:
- Node size reflects file size. Large files are visually prominent. You can immediately spot the dominant files in a project without reading a single line of output.
- Colors indicate language. Rust files are orange, JavaScript is yellow, Go is cyan, Markdown is dark green, config files are purple. The color legend makes it easy to see at a glance what a project is built from and where different languages cluster.
- Directories are green hub nodes with edges connecting them to their children. The force-directed layout naturally pushes unrelated clusters apart while keeping related files close, creating a spatial map that reflects the project’s logical structure.
The result is something closer to how experienced developers think about a project – not as a flat list, but as clusters of related files with varying importance.
Interactive, Not Static
The HTML output rv generates isn’t a dead image. You can scroll to zoom in on a specific area, drag the background to pan around, and shift-drag individual nodes to rearrange the layout. Hovering over a node shows a tooltip with the full file path and size. Clicking a directory collapses or expands it, letting you focus on the parts you care about.
There’s a search box (Ctrl+F) that filters the graph to matching files – useful for quickly answering questions like “where are all the test files?” or “is there a config directory?”
For situations where you need a static image – documentation, presentations, embedding in other tools – rv can also generate plain SVG output with --no-interactive.
Practical Use
The most common use is the simplest: run rv in your project root and open the resulting HTML file.
rv
This produces output.html in the current directory. For a specific project with a custom output name:
rv ~/projects/my-service -o my-service.html
For large projects where you want a high-level view without every deeply nested file:
rv -d 3 -o overview.html
The -d flag limits traversal depth, giving you just the top-level structure without the noise.
Sensible Defaults
rv automatically filters out directories that add noise without insight: node_modules, target, __pycache__, .git, vendor, build, dist, and other common build artifact and dependency directories. It also respects .gitignore rules, so your visualization reflects what’s actually in your project rather than what’s been generated or downloaded.
If you need to see everything, --all disables filtering.
Why a Graph?
Tree views – tree, file explorers, IDE sidebars – impose a strict hierarchy. You see the nesting structure, but you lose the relative proportions. A directory with three tiny config files looks the same as one with three enormous source files. Everything is the same font size, the same indentation depth, the same visual weight.
A force-directed graph solves this naturally. File size becomes node size. Directory depth becomes distance from the center. Language becomes color. The physics simulation handles layout, placing related files close together and pushing unrelated clusters apart. The result is a visualization where the important structural features – where the code mass is, what languages dominate which areas, how deep or shallow the nesting goes – are all visible simultaneously.
This is especially useful when you’re evaluating a project for the first time. A quick rv run tells you things that would otherwise take 15 minutes of poking around: is this a monolithic project with one huge source directory, or is it cleanly modular? Is there a test directory, or are tests co-located with source? How much is code versus configuration versus documentation?
Getting Started
rv is written in Rust. Clone and build:
git clone https://github.com/grahambrooks/rv.git
cd rv
cargo build --release
cargo install --path .
After installation, rv is available as a command anywhere on your system.
The project is MIT licensed and available at github.com/grahambrooks/rv.
rv is part of a set of tools for making codebases more legible. See also codecity, which visualizes repositories as 3D city skylines, and codemap, which builds semantic knowledge graphs for AI agents. Each approaches the same problem – understanding code without reading all of it – from a different angle.