---
title: 'infographic v2026.10.1: the first release, with animated SVG explainers from a one-line request'
url: https://www.grahambrooks.com/post/infographic-first-release/
date: 2026-10-25T06:11:37-06:00
author: Graham Brooks
description: infographic v2026.10.1 is the first release of a Claude Code skill and Rust CLI that turn a one-line request into an animated, checked SVG explaining a technical pattern, with prebuilt binaries for macOS and Linux.
tags:
- diagrams
- ai-agents
- rust
- developer-tools
- Continuous Delivery
---
# infographic v2026.10.1: the first release, with animated SVG explainers from a one-line request
*Ask for a diagram of the circuit breaker pattern and you get a picture. Ask whether the picture says what you meant, and nobody checks. infographic is my attempt at the checking half.*
**infographic** is a Claude Code skill plus a Rust command-line tool that produces animated SVG infographics explaining technical patterns and processes: the circuit breaker, retry with backoff, the TCP handshake. It's for anyone who writes READMEs or docs and wants a diagram that moves through the steps of a process, in light and dark themes, without drawing it by hand.
You ask for one in Claude Code with the skill:
```
/infographic for the circuit breaker pattern
```
Claude designs the story and writes a YAML spec. The `infographic` CLI does all the layout, timing, SVG output and verification, and reports findings against the spec. Claude fixes those findings in the spec, never in the SVG. That split is the whole idea: the model decides what the picture says, and a deterministic program decides where everything goes and whether it works.
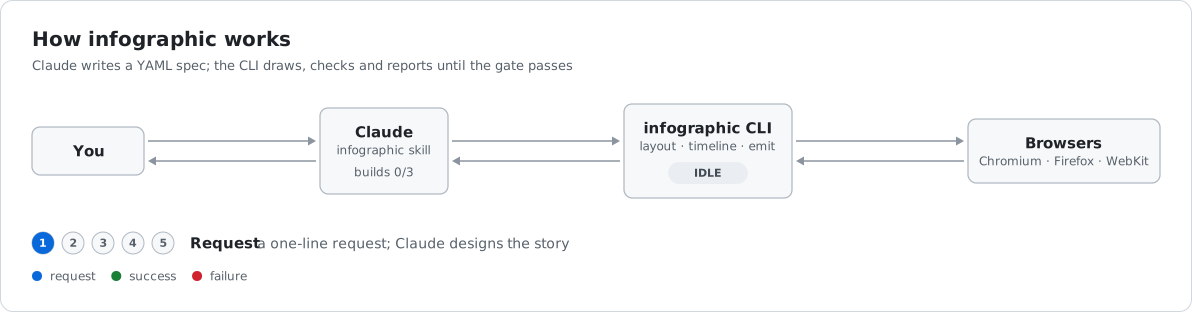 This is v2026.10.1, tagged on 24 October 2026, and it's the first release. It covers 25 commits, the earliest dated 27 September. So "what changed" here is mostly "what exists now", plus one feature added late.
## What you can do with it
`infographic build examples/circuit-breaker.yaml -o /tmp/out` writes light and dark SVGs, a storyboard PNG (one frame per phase), and a `` snippet for embedding in a GitHub README. `infographic check any.svg` verifies an SVG. Both print a JSON report, which is what lets the agent iterate until the gate passes.
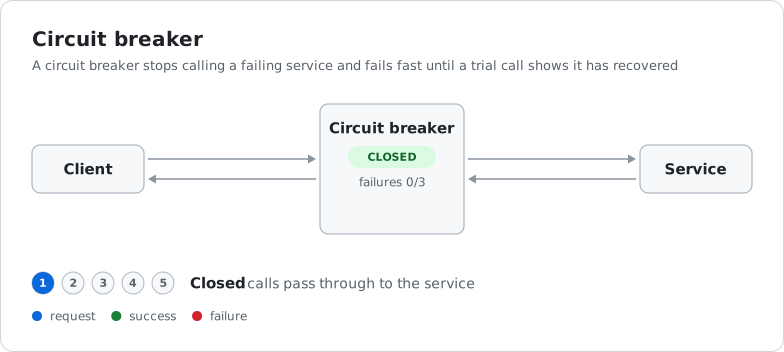
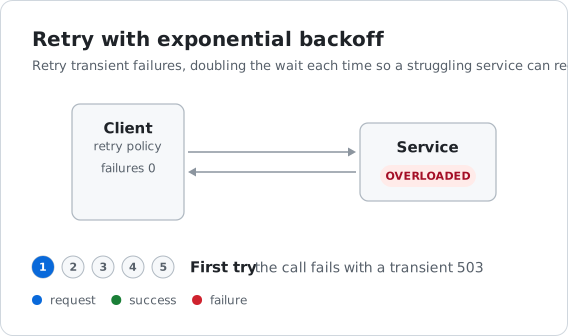
The repository's showcase page has five infographics, each with its spec. Four came from one-line requests to fresh agents: circuit breaker (5 phases, a 25.7 second cycle), retry with exponential backoff (5 phases, 20.0 seconds), transactional outbox (5 phases, 24.3 seconds) and the TCP three-way handshake (6 phases, 23.6 seconds). The fifth is the project's own pipeline header. The showcase reports that each one matched what the timeline intends in Chromium, Firefox and WebKit, in light and dark, across 6 checks per infographic.
Here's the circuit breaker. It animates through its five phases on a 25.7 second cycle:
 ## What the benchmark rounds changed
Most of the 25 commits are the loop of running those scenarios, finding where the tool let the agents down, and fixing the tool. The showcase page records three rounds, and it's candid about them.
Round 1, against the milestone 1 tool, passed all three scenarios but exposed real bugs. In the retry run, a second timer showed the wrong label and never animated, with no finding from the checker. Storyboard rows in the outbox and TCP runs came out empty or without packets. I fixed per-phase timers and changed storyboard capture to grab each frame at the telling moment.
Round 2 reran the same requests. Build rounds dropped from 5, 3 and 5 to 2, 3 and 3. Every phase with traffic now shows it in its storyboard frame, and a test checks that for every spec in the repository. The rerun also turned up four bugs in the tooling around it, such as `build --frames` leaving stale frames from earlier builds and producing false mismatches.
Round 3 added what the agents had been working around. Flows can now `delay`, timers take `seconds`, and flows take a `label` and `reply_label` that travel with the token. In practice, retry with backoff is drawn at true scale, with timers of 1s, 2s and 4s, and SYN and ACK are labelled on the wire instead of living only in captions. All three scenarios took 3 builds and passed, and the first build passed the gate every time. The remaining fixes all came from the agents' own storyboard review.
That last point is worth being plain about. The gate catches layout and timing problems. It doesn't catch a caption that claims "data both ways" when the motion doesn't show it. Those were caught by an agent looking at the storyboard. The showcase also lists seven open gaps, such as badges changing at phase start rather than when the message arrives. This is one tool tested on three patterns, so read the numbers as a sign the loop is working, not as a measure of how it will do on yours.
 ## Pinning a node's column
The one new feature late in the cycle is `rank`. Nodes are placed in columns left to right by their edges, and nodes in the same column stack vertically. Sometimes that puts a node where you don't want it, for example a second client that ends up one column too far right. Setting `rank: 0` on a node pins it to that column, and the rest are ranked as before. A test covers the case where a pinned node stays with its peer.
## Dependencies and packaging
Two dependency bumps are marked as breaking in their commit: serde-saphyr to v2 and Playwright to 1.64.1. Both landed on 24 October. Along the way there was a minimal cargo merge gate in CI, and the usual Renovate churn: `serde_json` 1.0.154, a newer `actions/checkout`, and lock file maintenance. The serde-saphyr change shouldn't affect existing specs: infographic only calls `from_str`, which the 2.0 breaking changes don't touch, and every spec under `examples/` and `infographics/` still built after the upgrade.
The last change, "Prepare for open source with release binaries", is why this is a release at all. There are now prebuilt binaries, and the license is MIT. The binary bundles IBM Plex Sans under the SIL Open Font License 1.1, and `infographic licenses` prints both.
## Install
The CLI is a single binary for macOS and Linux, on arm64 and x86-64.
Homebrew:
```bash
brew tap grahambrooks/infographic https://github.com/grahambrooks/infographic
brew install grahambrooks/infographic/infographic
```
Or download the archive for your platform from the [latest release](https://github.com/grahambrooks/infographic/releases/latest), check it against `SHA256SUMS`, and put `infographic` on your `PATH`.
Or build from source, which needs Rust 1.99 or later:
```bash
cargo install --git https://github.com/grahambrooks/infographic
```
The skill is separate. Copy `.claude/skills/infographic/` from the repository into `~/.claude/skills/` to use it in any project, or work inside a clone of the repository, where Claude Code picks it up automatically.
There's no earlier release to upgrade from, so there's no upgrade path to describe yet. If you try it, the most useful thing you can send me is a pattern it draws badly.