Over the last month or so I have been writing some data collection and simple analysis routines for the things we (developers) use every day. The ultimate goal is to have a system that can collect, interpret and recommend actions based on data from source code, version control, build and other systems related to software development. The project is kuona.
GitHub has 1000s of project repositories publicly available. This article is about one of them elasticsearch
kuona is using elasticsearch for data storage so it made sense for elasticsearch to be the an initial candidate.
GitHub already provides a contributor graph page which is a useful comparison for the first chart generated - Number of commits per day over the lifetime of the project.
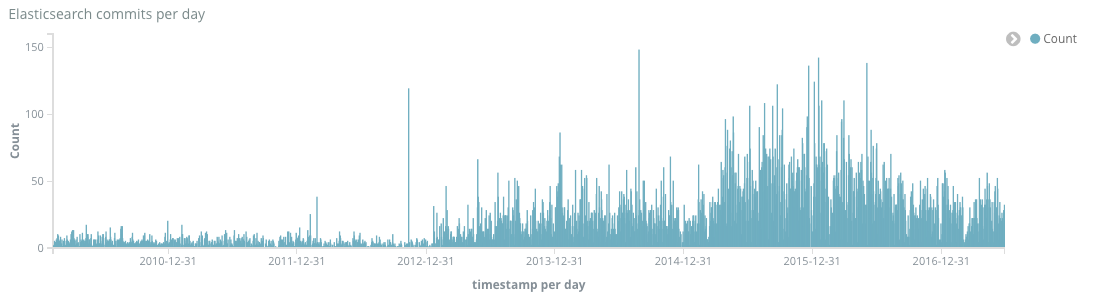
Nothing really surprising here and a reasonable correlation to the github version.
The next chart is a little more relevant to the title. Lines of code for each commit on the master branch.
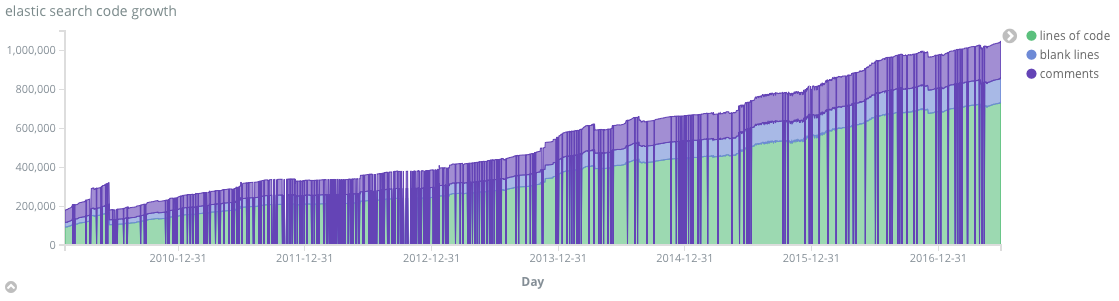
The vertical purple lines indicate days when there were no commits. What’s interesting and requires more input is that there are some pretty significant code change (reduction points)

Given the scale of the chart these code drops are pretty significant. Probably due to refactoring.
Elasticsearch has been in very active development starting in 2013 - number of commits per day increased by between 2x and 5x the previous years. There are some significant spikes of commits (148 Aug 27 2014). The code growth reflects the commit rate and started accelerating at the end of 2014.
Just looking at these charts makes me want to look at other areas.
-
Is code duplication at a healthy level. Code is being added faster than it is being removed.
-
Is the volume of code making it harder to resolve issues?
-
What is the ratio of test code to production code?
-
How has build time changed over time?
-
How does elasticsearch compare against similarly sized code bases?
Next steps
Currently focusing on gathering the same data from many more (1000s) of code bases that are publicly available. Once gathered we will need to work out how to compare codebases are there correlations between size/maturity/comments to popularity/adoption.
After gathering lots of code the next focus is on depth - number of modules, ratios of test to production code over time. External dependencies. Issues/defects etc.